
It is one of the most common questions among investors, especially at the start, when you are still working out how to begin investing and lack reference points to judge whether a performance is good or not. Here is how to read the figures correctly.
What is the time-weighted rate of return (TWRR)?
The TWRR assesses a portfolio's performance while setting aside the amount and timing of your deposits and withdrawals. It only reflects the investments' own performance, without being influenced by your decisions to invest more or less at a given moment.
It lets you judge how sound the investment choices were.
The TWRR is particularly useful for measuring the performance of an investment strategy in its own right and comparing it with an index or a fund, regardless of when money was paid in or taken out.
What is the money-weighted rate of return (MWRR)?
The MWRR, on the other hand, generally corresponds to the portfolio's internal rate of return, or IRR. It looks for the rate that matches the various amounts paid in or taken out with the final value of the portfolio.
It therefore highlights the effect of your timing: with the same amount, two investors can end up with very different MWRRs, depending on whether they added to their position when prices fell or bought at the top.
The MWRR is particularly useful when you make several deposits or withdrawals, since it takes their exact amount and date into account. It can, however, be strongly influenced by a large deposit made just before a market rise or fall. On its own, it therefore cannot tell you whether the investor showed real skill in anticipating the market.
An example to make it clear: Marc and Sophie
Take Marc and Sophie, who each invest CHF 10,000 in the same fund in January. They experience exactly the same market movements. Only one decision sets them apart.
- First half of the year: the fund falls by 10%. Both Sophie's and Marc's portfolios are now worth only CHF 9,000.
- Extra deposit: Marc adds CHF 10,000 after this fall. His portfolio then reaches CHF 19,000. Sophie makes no deposit.
- Second half of the year: the fund then rises by 20%.
- At the end of the year: Sophie's portfolio is worth CHF 10,800, Marc's CHF 22,800.
TWRR
The fund's own performance is the same for both: (1 − 10%) × (1 + 20%) − 1 = 8%.
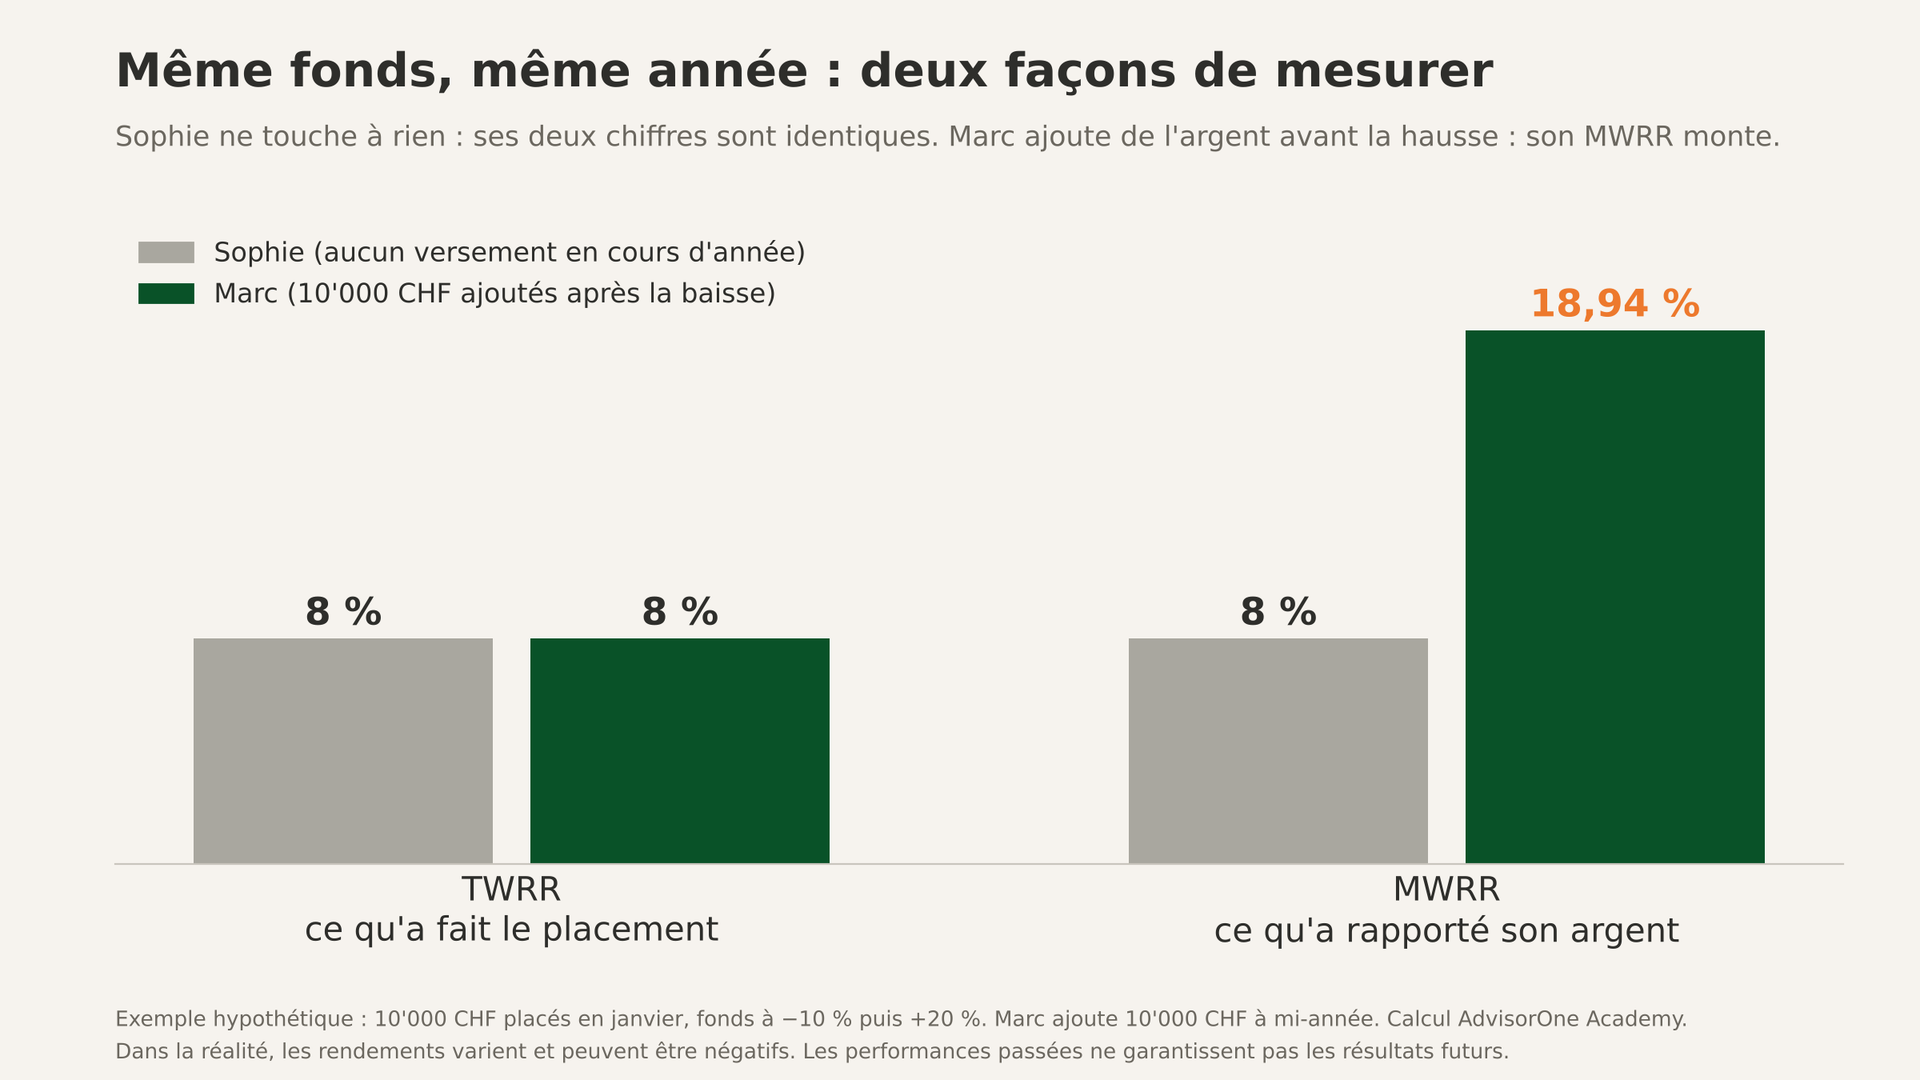
Marc and Sophie therefore both show a TWRR of 8%.
MWRR
Marc's MWRR is higher than Sophie's, because Marc had more money invested during the 20% rise.
His MWRR, calculated over the year, is about 18.94%, compared with 8% for Sophie.
What to take away from the example
The TWRR measures the performance of the investment. The MWRR measures the performance experienced by the investor, taking into account the timing and size of their deposits and withdrawals.
This gap is not just theoretical. It explains why investors can earn less than the funds they hold, often because of decisions taken in the heat of the moment.
It should be stressed, however, that Marc's good result does not necessarily prove that he knows how to anticipate the market. His deposit may come from a considered decision, a regular investment plan or simple luck. Trying to predict the right moment remains very uncertain, and waiting for the right time to invest often turns out to be a mistake.
How are these two rates calculated?
There is no need to do the calculations yourself, as your bank does it for you. Understanding their logic still helps you know what each figure measures, and what it leaves out.
The TWRR, period by period
The calculation splits time at each deposit or withdrawal.
- Identify each date on which money comes into or goes out of the portfolio.
- Calculate the return for each period between two of these dates.
- Multiply these returns together to get the total return.
This is exactly what was done for Marc and Sophie: one period at −10%, then one period at +20%. This method requires knowing the value of the portfolio at each movement of money, which banks do automatically.
The MWRR, the rate that balances the flows
The MWRR looks for a single rate that links all the deposits to the final value. For Marc, it is the rate at which CHF 10,000 invested for one year and CHF 10,000 invested for six months together become CHF 22,800.
This rate is about 18.94%. You cannot work it out in your head, but a spreadsheet or a financial calculator finds it in a few seconds, from the dates and amounts.
How do you read these figures on your statement?
A percentage on its own says little. Three simple reflexes help you know what it really measures and whether it can be compared with another figure.
Check the period
A performance figure can be cumulative since the account was opened, calculated for the current year or converted into an annual average. 12% over three years does not mean the same as 12% over one year. Before any comparison, make sure both figures cover the same period.
Be wary too of a return calculated over a few weeks and then converted to a yearly figure. It assumes the same trend will repeat for twelve months, which rarely happens.
Check whether fees are deducted
A performance figure can be shown before or after management and custody fees. The difference looks small over one year, but the weight of fees over time quickly becomes significant. Look on your statement for the words "net" or "gross", and ask for this information if it is missing.
Also look at the amounts in francs
Percentages do not tell the whole story. Over the year, Sophie gained CHF 800 on CHF 10,000 paid in, and Marc CHF 2,800 on CHF 20,000 paid in. The amount in francs reminds you what the investment actually brought in, or cost. A high percentage on a small sum can bring in less, in francs, than a modest percentage on a larger amount.
Conclusion
When it comes to TWRR vs MWRR, the two are complementary ways of measuring performance. The TWRR is particularly suited to assessing the performance of a strategy in its own right or comparing it with an index, while the MWRR better reflects the investor's personal experience and the impact of their deposits and withdrawals.
You do not always need to use both indicators. The right choice depends above all on the question you are trying to answer.
To take a first step today, open your latest statement and look for which method your bank uses. If nothing is stated, simply ask.
One figure properly understood is worth more than ten figures skimmed.
To get started: the Academy's Foundations programme, free, helps you lay the groundwork for your financial freedom.
To go further: the AdvisorOne Diagnostic takes a few minutes to show you where you stand, with no commitment.
FAQ
What is the main difference between TWRR and MWRR?
The TWRR measures the pure performance of the investments, without taking into account when money comes into or goes out of the portfolio. The MWRR measures the return your money actually earned, including the timing of deposits and withdrawals. Both figures can be correct at the same time: they simply answer two different questions.
Which one should I use to compare my results with someone else's or with an index?
The TWRR is the right indicator. By neutralising the effect of when deposits were made, it isolates the quality of the investment choices, which makes the comparison truly relevant. To judge your own experience as an investor, deposits included, the MWRR is more telling.
Why can two investors in the same fund get different MWRRs?
Because the MWRR takes into account the timing and amount of each deposit or withdrawal. An investor who puts in a large sum before a rising period can get a higher MWRR. Conversely, a deposit made just before a fall can drag their MWRR down.
Does a high MWRR necessarily mean the investor anticipated the market well?
Not necessarily. A high MWRR can result from good timing, but also from a regular deposit that happened to fall at a good moment, or a large deposit made before a rising period. This indicator describes the return you personally achieved, but on its own it cannot separate skill from luck.
Why do fund managers often use the TWRR?
Because it neutralises the effect of deposits and withdrawals decided by clients. It therefore helps isolate the strategy's performance and compare it with an index or another manager. The GIPS standards, the international standards for presenting investment performance, generally require it. The MWRR is only allowed if the manager controls the cash flows and the investment is, for example, closed-end or largely illiquid.
Why can the return shown by my bank differ from the fund's?
Your bank may show a money-weighted return, which takes your deposits and withdrawals into account, while the performance published by the fund is generally calculated regardless of your personal cash flows. The two figures can therefore differ without either one necessarily being wrong.
⚠️ Important notice ⚠️
The information presented in this article is provided for purely informational and educational purposes. It does not in any way constitute a personalised recommendation, investment advice, an offer or a solicitation to buy or sell financial products.
Any investment decision should be made after a thorough analysis of your personal situation, your objectives and your risk profile, and may require the advice of an authorised financial adviser.
Past performance is no guarantee of future results. Investments involve risks, including the risk of capital loss.